Measure Headless Browser Bandwidth: How Developers Avoid Paying Twice

Headless mode trims UI and rendering overhead, but most of your bandwidth bill comes from page assets and network activity, not the browser engine itself. The fastest wins come from blocking unnecessary resources, caching repeated assets, and tuning concurrency so you're not paying for the same bytes twice. Full browsers still earn their place when visual fidelity matters more than speed.
TL;DR:
- Blocking images, fonts, and tracking scripts can significantly reduce bandwidth without affecting core functionality, especially when only textual data is needed.
- Measuring baseline metrics such as bytes transferred, request types, and load timing is essential before applying any optimization to understand where the most savings can be made.
- Reusing browser contexts, limiting concurrency, and caching assets help prevent redundant requests and lower overall network load, especially on high-traffic pages.
- Routing sessions through real carrier IPs rather than data centers decreases retries and failed requests, which cuts wasted bandwidth and reduces associated costs.
- Effective optimization depends on incremental testing, careful rule management, and balancing session count with hardware capacity to avoid saturating bandwidth or triggering site defenses.
Table of Contents
- How headless browsers consume bandwidth
- Measuring bandwidth use for headless sessions
- Bandwidth optimization techniques for headless automation
- Concurrency and session planning for headless bandwidth
- Network and proxy considerations that change bandwidth costs
- Benchmarks and testing patterns to validate bandwidth savings
- Practical checklist and sample configuration snippets
- What proxy reliability really does to your bandwidth bill
- How MaskLabs helps you cut proxy-related bandwidth waste
- Sources
- FAQ
How headless browsers consume bandwidth
A headless browser shares the same JavaScript engine and network stack as its full-browser counterpart. For raw JavaScript execution and DOM operations, modern headless browsers perform almost identically to full browsers, according to browserless, which means the bandwidth difference you're chasing isn't coming from the engine. It's coming from what the page requests.
Every session pulls a mix of payload types, and they don't weigh the same:
- Images and video thumbnails, often the single largest contributor on media-heavy pages.
- JavaScript bundles, including framework code that loads even when you only need the rendered HTML.
- Web fonts, which many sites load in multiple weights regardless of what's visible.
- XHR and fetch calls triggered by client-side rendering, lazy-loaded sections, or websocket connections that stay open after initial load.
Client-side rendering is the part developers underestimate. A page that looks "loaded" at domcontentloaded can keep firing requests well after that event, through infinite scroll triggers, analytics beacons, or chat widgets that open a persistent connection. Third-party trackers and ad tech frequently account for a disproportionate share of total transfer, sometimes outweighing the content you actually came for. None of this is a headless-specific problem. It's a web-page problem that headless automation simply inherits at scale, one session at a time, hundreds or thousands of times a day.
Measuring bandwidth use for headless sessions
You can't optimize what you haven't measured, and baseline measurement should come before any optimization effort, per IBM's network optimization guidance. Skipping this step means you are guessing at which lever matters.
Start with these metrics and methods:
- Bytes transferred per session, captured through Chrome DevTools Protocol network events or Playwright and Puppeteer route handlers that log response sizes.
- Requests per session, broken out by resource type, so you can see whether images, fonts, or XHR calls dominate.
- Time to first byte and the gap between
domcontentloadedandload, which tells you how much network activity happens after the page appears finished. - Throughput, measured with OS-level counters or
tcpdumpwhen you need traffic visibility below the browser layer. - Proxy metering data, if you're routing through a proxy, since per-byte billing gives you a second, independent read on actual transfer.
Build your baseline from a representative sample of pages rather than a single easy case. Run each page a few times to warm up DNS and connection caches, then record median values instead of the first run, which is almost always the slowest. Once you have numbers, correlate them with CPU and memory usage and request success rates. A page that looks cheap in bytes but burns CPU on JavaScript execution, or one that fails and retries, will mislead you if bandwidth is the only number you track.
Bandwidth optimization techniques for headless automation
Once you know where the bytes go, the fixes are mostly mechanical. Start with the highest-leverage change and work down.
Resource blocking through request interception is the biggest single lever. Playwright and Puppeteer both let you intercept requests and abort them by resource type or URL pattern:
- Block image, font, and media requests when you only need text or structured data.
- Block known tracker and ad domains, which often account for a large share of requests without contributing to the content you need.
- Use pattern-based rules rather than a blanket deny-all, since some sites detect missing assets and trigger fallback XHRs or heavier JavaScript when a resource fails to load, according to Dotcom-Monitor's load testing research.
- Allow critical third-party scripts explicitly when blocking them breaks authentication, payment flows, or content rendering.
Disabling unneeded browser features cuts background network chatter you never asked for, things like update checks, telemetry pings, and extension sync. Several Chromium flags exist specifically to turn these off for automation contexts.
Caching deserves more attention than most scraping setups give it. Honoring standard HTTP cache headers means your automation doesn't re-fetch assets that haven't changed. For repeated crawls of the same domain, a local cache layer that stores common assets like logos, stylesheets, and fonts saves real bytes on every subsequent run. Conditional requests using If-Modified-Since or ETag headers let the server confirm nothing changed with a tiny response instead of resending the full asset.

Compression and request headers matter too. Make sure your client sends Accept-Encoding: gzip, br and that you're not accidentally requesting uncompressed variants. Some sites also respect a Save-Data header and will serve lighter image variants or skip non-essential scripts when they see it.
Selective rendering helps on top of all this. A smaller viewport reduces the resolution of responsive images the server decides to send. Emulating a mobile user agent often triggers a lighter, mobile-optimized version of the page. Low-data mode emulation, where supported, combines several of these effects automatically.
Pro Tip: Test blocking rules against a handful of representative pages before rolling them out broadly. A rule that saves bandwidth on one template can silently break form submission or content rendering on another.
Concurrency and session planning for headless bandwidth
How many sessions you run in parallel changes your bandwidth curve as much as any single-page optimization. A typical load injection server can simulate up to 10 to 12 simultaneous headless browser sessions, compared with hundreds of plain HTTP sessions, according to Dotcom-Monitor, because each headless session carries a far larger memory and network footprint.
Practical session density depends heavily on page complexity and your hardware. A few things to plan around:
- Aggregate bandwidth scales roughly linearly with concurrency, so doubling sessions without capping per-host throughput can saturate your connection or trigger rate limits on the target site.
- Reusing browser contexts instead of launching a fresh browser instance per job cuts startup overhead and avoids redundant initial requests like favicon and manifest fetches.
- Keep-alive connections and pooled HTTP clients reduce the TLS handshake cost that would otherwise repeat on every new connection.
- When you hit a throughput ceiling, adding machines usually beats pushing concurrency higher on one box, since a single host's network interface and CPU become the bottleneck first.
Network and proxy considerations that change bandwidth costs
If you're routing headless sessions through a proxy, the billing model changes how you think about bandwidth. Per-GB pricing means every blocked request you fail to intercept, every retry, and every unnecessary asset directly inflates your bill, not just your latency.
A few factors worth tracking:
- Proxy-induced overhead from TLS termination and extra network hops adds a small but real cost on top of the page's own payload.
- Sticky sessions keep the same IP for a set window, which helps maintain login state and reduces the chance of triggering a new challenge mid-session; rotating sessions trade that persistence for a fresh identity on each request, useful for high-volume crawling where you want to spread load across addresses.
- Route quality affects wasted bytes as much as it affects success rates: carrier IP paths tend to see fewer blocks and challenge pages than datacenter paths, which means fewer retried requests and less bandwidth burned on failed attempts.
- Metering proxy bandwidth per job, rather than per account, lets you find which specific crawl or test suite is driving cost, so you can fix the request pattern instead of just absorbing the bill.
Network-level techniques like traffic shaping, caching, and quality-of-service monitoring complement these browser-level choices, per TechTarget's bandwidth optimization guidance, and they work best applied alongside the request-level fixes rather than instead of them.
Benchmarks and testing patterns to validate bandwidth savings
A clean benchmark isolates the thing you're trying to measure. Open-source benchmarking projects use a minimal lifecycle, create, connect, navigate, release, as the clearest proxy for browser performance and reliability, since it strips out variables unrelated to the page itself, according to the browserarena benchmark project.
- Run a warm-up pass first and discard it; first-run timings are skewed by DNS lookups and cold caches.
- Repeat each test enough times to report a median rather than a mean, since a single slow run can distort an average.
- Keep the runner environment consistent, same machine class, same network path, same geographic region, so round-trip time doesn't vary between test runs and corrupt the comparison.
- Separate HTTP byte counts from rendering-triggered requests, since a page can look identical in rendered output while pulling very different amounts of data underneath.
- Report results as per-session bytes, request counts, and success rate together, since a bandwidth drop that comes with a higher failure rate isn't really a win.
Practical checklist and sample configuration snippets
Work through optimizations in order of impact rather than ease. The sequence below gets you most of the available savings with the least risk of breaking functionality.
- Baseline first. Measure bytes, requests, and load timing on representative pages before changing anything.
- Add block and allow rules. Intercept requests by resource type and domain pattern, blocking images, fonts, and known trackers while explicitly allowing anything tied to authentication or core content.
- Layer in caching. Honor cache headers and add a local cache for assets that repeat across sessions.
- Set concurrency limits. Cap sessions per host and reuse browser contexts instead of relaunching.
- Measure again and iterate. Compare the new baseline against the original before rolling changes out broadly.
Small configuration changes worth toggling early: a request interception pattern keyed on resource type, a Save-Data: on header where the target site supports it, explicit Accept-Encoding for compression, and Chromium flags that disable background sync and update checks.
When blocking breaks something, the symptom is usually a missing element or a stalled script waiting on a resource that never arrives. Check the browser console for failed requests tied to your block list and move that pattern to the allow list.
Pro Tip: Roll out blocking rules incrementally and A/B test each change against your baseline rather than applying a full rule set at once. That way you know exactly which rule produced the savings and which one, if any, caused a failure.
What proxy reliability really does to your bandwidth bill
Blocked and retried requests are invisible bandwidth waste. Real carrier IPs with city-level targeting reduce the block-induced retries that quietly inflate per-session transfer, since each failed attempt and its retry both consume bytes without producing usable data. High uptime and strong success rates mean fewer wasted requests overall, which lowers the effective bandwidth cost of every completed session, not just the successful ones.
— Jon
How MaskLabs helps you cut proxy-related bandwidth waste
Every blocked request your automation retries is bandwidth you paid for twice. MaskLabs routes your sessions through real US mobile carrier IPs instead of datacenter addresses, which means fewer challenge pages, fewer retries, and less wasted transfer on every job you run.
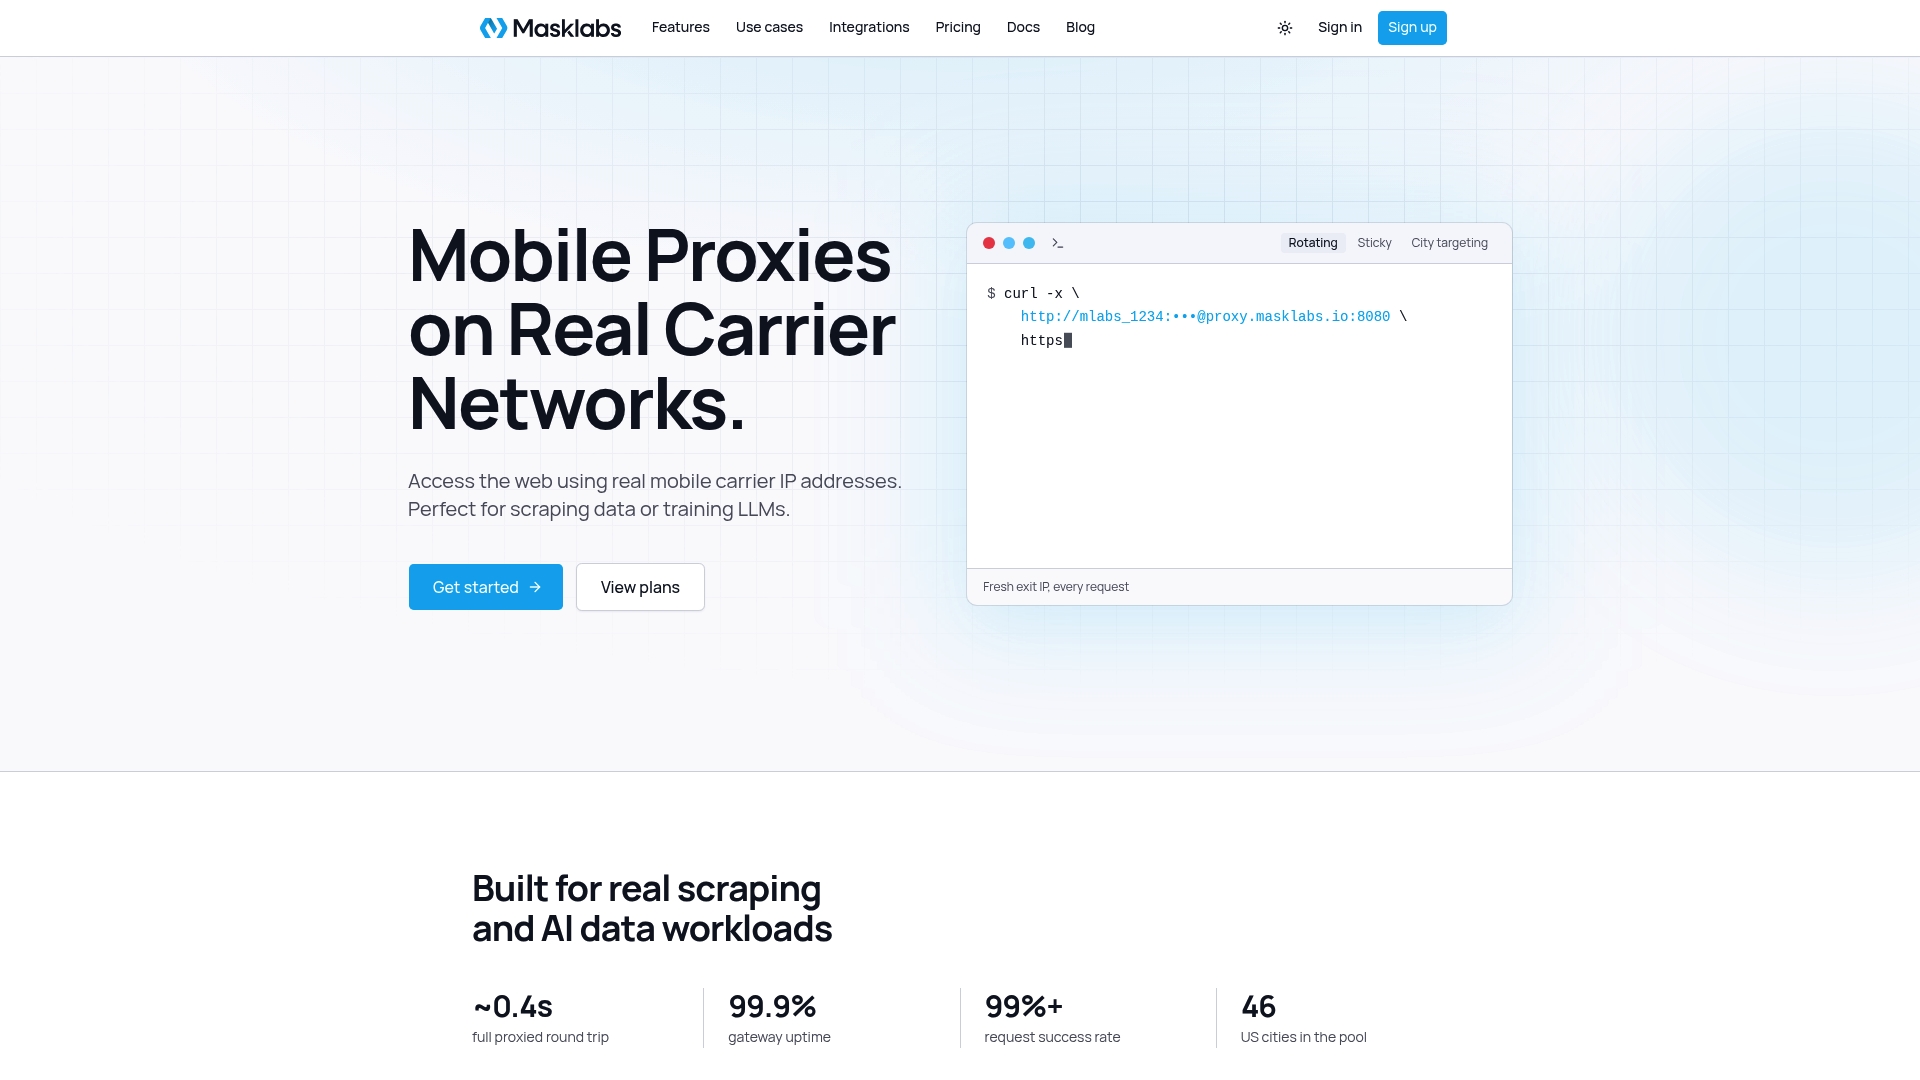
City-level targeting lets you match geolocation requirements without burning extra requests on redirects or location checks, and sticky or rotating sessions give you control over how long an IP persists before switching, so you can tune session behavior to the job instead of fighting default settings. Setup runs through a usage dashboard with no sales call required, and our guides on integrating proxies with browser automation cover request patterns that pair well with the optimizations above.
If you're ready to see the difference on your own traffic, check pricing for the Starter, Basic, Advanced, and Scale plans or start with a free trial to measure the bandwidth impact on your actual workload.
Sources
- Headless Browser vs. Real Browser: Definitions and Key Differences — browserless
- Load Simulation & Performance Test Types Explained — Dotcom-Monitor
- What Is Network Optimization? — IBM
- 8 tips to optimize network bandwidth and performance — TechTarget
FAQ
What is the fastest headless browser?
Speed depends more on what a page requests than on which headless browser you choose, since modern headless browsers share the same JavaScript engine as their full-browser versions, according to browserless. The bigger speed gains come from resource blocking, caching, and concurrency tuning rather than switching browser tools.
What are the disadvantages of using a headless browser?
Headless browsers can be detected by some sites through fingerprinting checks, and blocking too many resources can break pages that rely on fallback scripts when assets fail to load. They also sacrifice visual confirmation, which matters for tests that need to verify how a page actually looks.
Can a website detect a headless browser?
Yes, some sites use fingerprinting techniques and behavioral signals to flag automated traffic, which is part of why a hybrid approach, headless for bulk automation and full browsers for visual checks, is a common recommendation from browserless. Using authentic residential or mobile IPs alongside careful request patterns reduces the chance of triggering blocks tied to network origin.
How do I reduce bandwidth in headless browser automation?
Block unnecessary resources like images, fonts, and tracker scripts, enable caching for repeated assets, and cap concurrency so you're not duplicating requests across parallel sessions. Measuring a baseline before making changes, as recommended by IBM, lets you confirm which change actually saved bytes.
How many headless sessions can I run at once without saturating bandwidth?
A typical load injection server handles around 10 to 12 simultaneous headless sessions, compared with hundreds of plain HTTP sessions, according to Dotcom-Monitor, since each headless session carries a larger network and memory footprint. The right number for your setup depends on page complexity and available hardware, so test concurrency against your own baseline rather than assuming a fixed figure.