Proxy Uptime Monitoring: Run 3 to 5 Samples, Not One

Proxy uptime monitoring means running real requests through your proxies and measuring connect success, success rate, and time to first byte. The reliable setup uses multi-sample checks per proxy, not a single probe, so you can separate proxy faults from target-side blocks. Watch connect time, success rate, and TTFB together, and you will catch most failures before they cost you data.
TL;DR:
- Run 3 to 5 real requests through each proxy, increasing to 10 for flagged proxies; socket pings cannot confirm tunnel or target access.
- Track gateway connection time separately from target first byte time, then compare them to distinguish slow proxy handshakes from slow target responses.
- Use 10 to 15 second connection timeouts, match polling frequency to outage tolerance, and require two consecutive failed checks before paging.
- Run checks in each region, adding city level tests for geotargeting; investigate local failures locally and escalate failures across locations as pool wide incidents.
- Retain raw sample results, including exit IPs and failure classes, for 30 to 90 days to reconstruct incidents and support provider disputes.
Table of Contents
- What proxy uptime monitoring actually measures
- How to design effective proxy checks
- Diagnosing common failures: a taxonomy and triage steps
- Multi-location and geolocation checks: why and how to run them
- Observability: metrics, dashboards, and alert rules
- Operational checklist: alerts, retention, and runbook steps
- Operational priorities and trade-offs worth naming
- When mobile, city-level proxies change the monitoring picture
- FAQ
- Sources
What proxy uptime monitoring actually measures
A useful check reports more than "up" or "down." It tracks gateway connect time (how long the TCP/TLS/CONNECT handshake takes), tunnel success (whether the proxy actually opens a path to the target), TTFB from the target once the tunnel is live, overall success rate across samples, the count of distinct exit IPs seen during rotation, and latency percentiles across the pool.
Monitor configs convert those raw samples into a verdict using rules like samples, minSuccess, and minHealthyPct, a model used by production tools such as UpButler's proxy monitors.
- Gateway connect time and TTFB are tracked separately to localize where delay happens.
- Success rate is calculated per proxy across a batch of samples, not from one request.
- Pool health rolls up individual proxy verdicts into a single healthy, degraded, or down state.
A practical example uses multiple samples per proxy, a minimum number of successful samples required, and marks the pool down if fewer than a certain portion of proxies are healthy.
How to design effective proxy checks

Always push a real HTTP(S) or SOCKS request through the proxy to a judge endpoint. A real-request checker like Proxycanary reads the exit IP and response headers, which a raw TCP ping cannot do, and that gap is why socket-only checks produce false "alive" signals.
Build the check around these steps:
- Send 3 to 5 samples per proxy for routine health checks, and raise to 10 when diagnosing a flagged proxy, balancing detection confidence against the extra egress traffic each sample costs.
- Set timeouts around 10 to 15 seconds for the connect phase and a shorter window for TTFB, then align both with the SLA you have committed to internally.
- Run checks on an interval that matches your tolerance for missed outages. UptimeRobot's plan tiers illustrate the trade-off well: 5 minute checks on free tiers versus 60, 30, or 15 second intervals on paid plans, with shorter intervals catching brief outages at the cost of more noise and spend.
- Pair a judge endpoint check with a second "real-target" check when the target's own blocking behavior matters, since a proxy can pass the judge test and still fail against a specific site's filtering rules.
Pro Tip: Run your judge and real-target checks on separate schedules so a target-side block never gets misread as a proxy outage.
Diagnosing common failures: a taxonomy and triage steps
Most proxy incidents fall into a small set of repeating patterns, and documented failure classes from production monitors give you a shared vocabulary for triage.
- proxy_unreachable: the gateway never responds; check provider status and network routes before anything else.
- proxy_auth_failed (407): credentials are wrong, expired, or mismatched to the pool; verify the auth header against your proxy authentication setup.
- rate_limited (429): you're exceeding a concurrency or request cap; reduce thread count and re-run a small sample.
- tunnel_refused (403): the proxy rejects the CONNECT request; confirm protocol support and IP allowlisting.
- target_unreachable (502 to 504): the target server, not the proxy, is failing; a direct (no-proxy) baseline request confirms this quickly.
- timeout: slow handshake or slow target; compare gateway connect time against TTFB to see which phase is slow.
- wrong_exit_country: rotation handed you an IP outside the expected region; re-query the judge endpoint to confirm.
- not_rotating and exit_ip_is_proxy: session stickiness or detection logic is misbehaving; request a fresh session before escalating.
Before contacting a provider, re-run the failing sample, confirm the exit IP through a judge endpoint, and check whether the same failure reproduces on a direct connection.
Multi-location and geolocation checks: why and how to run them
A proxy pool can look fully healthy from one vantage point and still be broken for users elsewhere, since CDN routing, peering paths, and carrier-specific outages are regional by nature.
- Run checks per region at minimum, and per city when your use case depends on granular geotargeting, such as local ad verification.
- Configure an expectCountry rule so a mismatch flags as wrong_exit_country rather than a generic failure.
- Treat a single-vantage failure as a signal to investigate that location specifically, but treat a multi-vantage failure as a pool-wide incident that needs immediate escalation.
- Use exitIpDiffers checks to confirm rotation is actually changing the exit IP between samples, not just reporting a new timestamp.
Observability: metrics, dashboards, and alert rules
Exporting the right metrics turns proxy monitoring into something your team can act on instead of just watch. Core exports should include proxy_connect_duration, proxy_ttfb_seconds, proxy_requests_total, proxy_egress_bytes_total, and proxy_active_tunnels, labeled by provider, pool_type, target_host, and status_code.
Guidance on instrumenting proxy fleets with Prometheus and Grafana recommends a 15 second scrape interval for production fleets, which is frequent enough to catch short-lived spikes without overwhelming your time series storage.
- Use histogram buckets tuned for proxy transit rather than generic web-latency defaults.
- Write PromQL for a rolling 5 minute success rate so dashboards reflect recent behavior, not a noisy instant value.
- Alert separately on 407 and 429 spikes, since each points to a different root cause.
A proxy that is technically reachable can still fail a target's compatibility check, which is why separating gateway health from target-side status prevents wasted troubleshooting time.
Dashboard panels worth building: P50/P90/P99 TTFB heatmaps, an error ratio trend, egress cost over time, and active tunnel concurrency.
Operational checklist: alerts, retention, and runbook steps
A short, repeatable checklist keeps incident response consistent across your team.
- Alert when success rate drops below your minSuccess threshold, but require two consecutive failing checks before paging anyone, which cuts false positives from transient blips.
- Retain raw per-sample results, including connect time, total time, exit IPs, and failure class, for 30 to 90 days so you can reconstruct incidents and back up SLA disputes with a provider, a practice outlined by the flashproxy-sla project.
- Keep status pages limited to pool health and region, and never publish credentials or internal endpoint details.
- On a 429 spike, cut concurrency first. On a 407 spike, check credentials before anything else. On a timeout spike, compare gateway time against TTFB to find the slow phase.
| Alert type | Confirmation rule | First action |
|---|---|---|
| Success rate below threshold | 2 consecutive checks | Re-run sample, check provider status |
| 407 spike | 1 check, high confidence | Verify auth credentials |
| 429 spike | 1 check, high confidence | Reduce concurrency |
| Gateway timeout | 2 consecutive checks | Compare connect time vs TTFB |
Operational priorities and trade-offs worth naming
We lean toward judge-endpoint checks with multiple samples over frequent single-sample polling, because one noisy ping tells you far less than three or five real requests spread over a few minutes. The real trade-off in this work is speed against cost: tighter intervals catch outages sooner but burn more traffic and raise false-positive risk if you skip confirmation rules.
— Jon
When mobile, city-level proxies change the monitoring picture
Some monitoring scenarios need more than a healthy pool, they need the right kind of exit IP. Ad verification, mobile UX checks, and geo-specific content validation all depend on exits that look like genuine local traffic rather than a datacenter range a target can flag on sight.
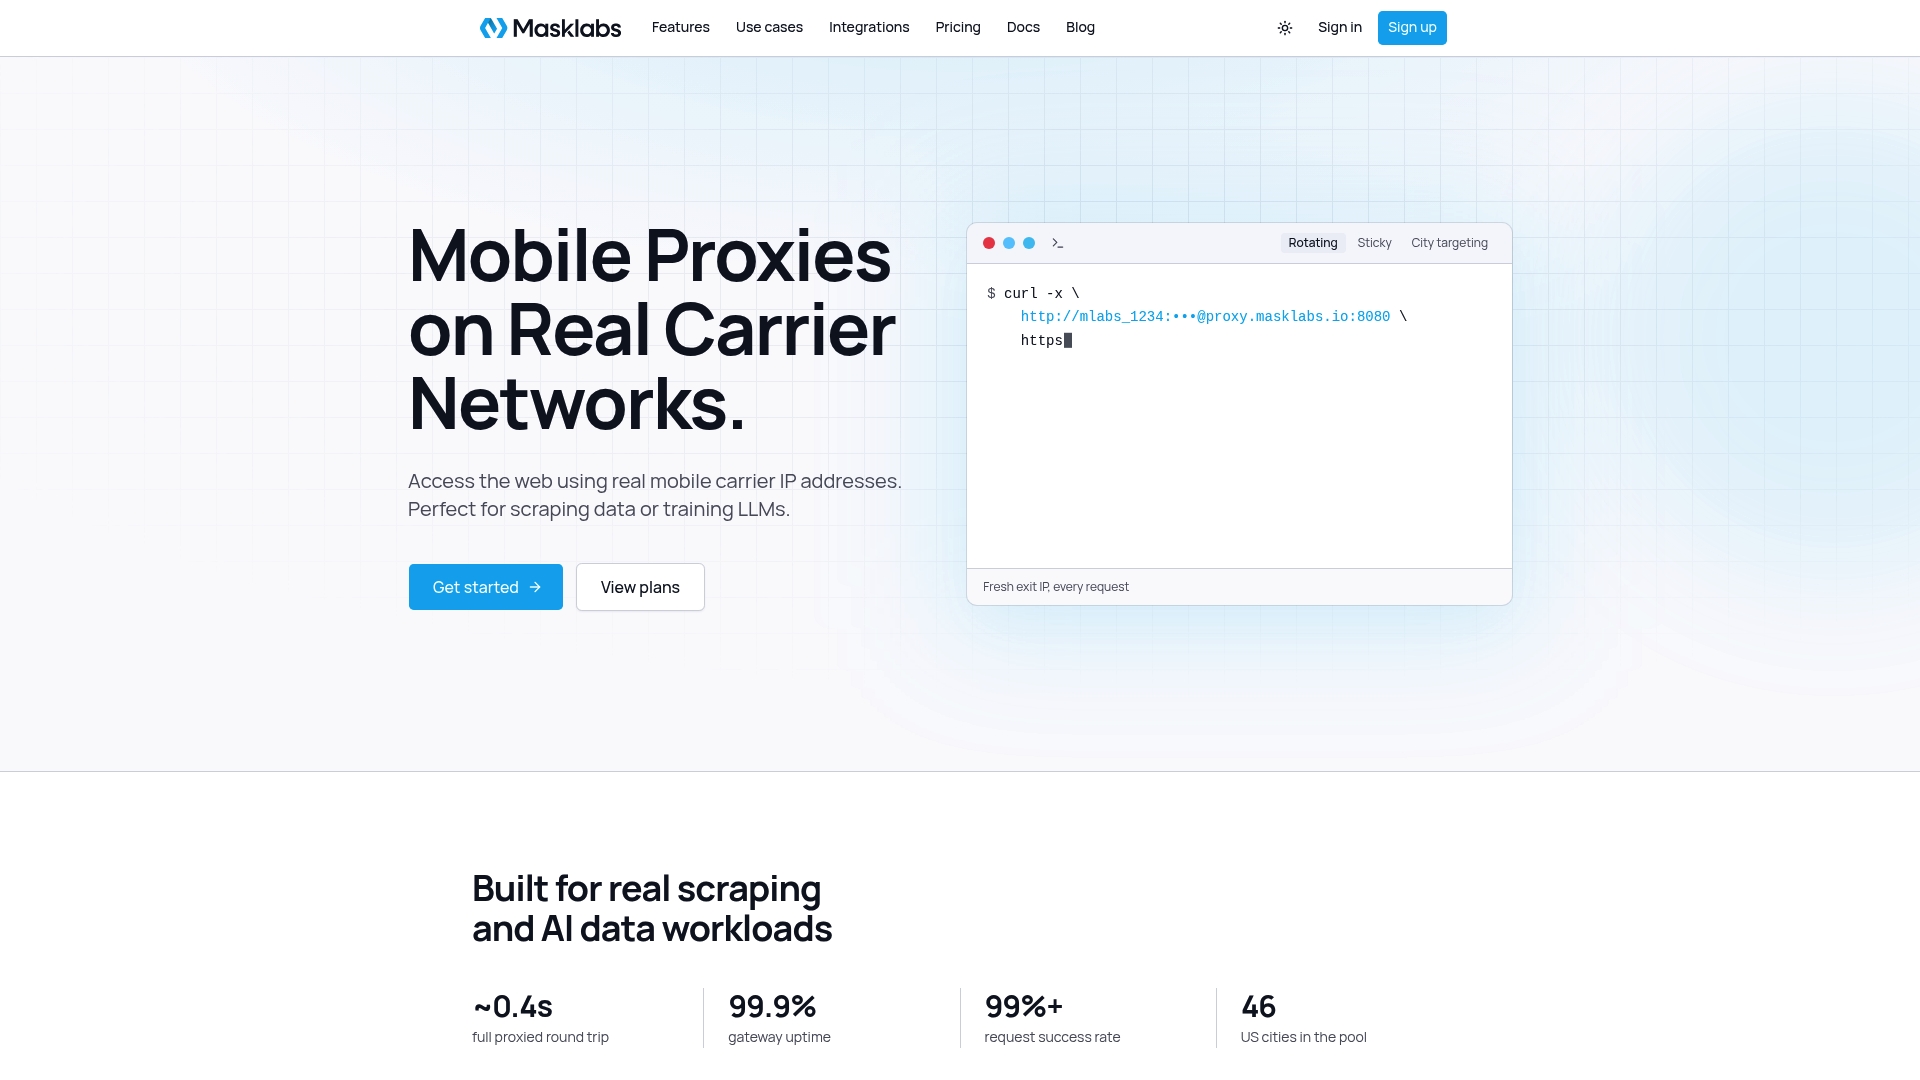
That's the gap our mobile proxy service is built for: real US mobile carrier IPs with targeting by city and options for sticky or rotating sessions depending on whether your check needs a stable identity or fresh IPs on every sample. Check current plans and data pools on our pricing page if city-level, carrier-grade exits fit your monitoring use case.
FAQ
What is the best free website uptime monitoring tool?
There is no single tool that fits every setup, since "best" depends on check frequency, regions, and integrations you need. Free tiers from mainstream uptime services typically offer checks every 5 minutes, per UptimeRobot's published plans, which is enough for general website monitoring but too coarse for diagnosing short proxy-specific outages.
How can I monitor my internet uptime?
You can monitor general internet uptime with a standard checker that pings a target on a fixed interval, but proxy-based operations need a real HTTP request through the proxy to a judge endpoint instead. That distinction matters because a socket-level ping can report "alive" even when the proxy tunnel itself is failing.
Which website uptime monitoring service is the best?
The right service depends on whether you are monitoring a website directly or monitoring proxies that sit in front of requests. For proxy-based operations, prioritize a tool that supports multi-sample checks, judge endpoints, and failure classification over one built only for simple website pings.
Is UptimeRobot free to use?
UptimeRobot offers a free tier with 5 minute check intervals, while faster intervals of 60, 30, or 15 seconds are available on its paid plans. The free tier works for general uptime checks but will miss short-lived proxy failures that a tighter interval would catch.
What does a "wrong exit country" failure usually mean?
A wrong_exit_country failure means the proxy returned an exit IP outside the region your check expected, which usually points to a rotation or routing issue rather than a target block. Re-querying a judge endpoint confirms the actual exit IP and country so you can rule out a false alarm.
Sources
- UpButler docs — proxy monitors
- Monitor Proxy Pools With Prometheus and Grafana · ProxyLister
- Proxycanary — real-request proxy checker
- flashproxy-sla (GitHub)
- Plans & Pricing | UptimeRobot